Thing dashboard
The thing dashboard page allows users to analyze the data sent by the thing and enter the various management functions.
 Let's start by describing the information contained into the header section:
- back button: it will bring you back to the thing list;
- name of the thing and network of belonging (in brackets);
- edit, manage and share buttons. They will be described in the rest of this page. Please note that they may be visible or not depending on user permissions;
- the connection status of the thing and the time of the last connection or disconnection;
- the lifecycle status of the thing;
- the family to which it belongs and the version (in brackets);
- the selector of the dashboard to display under the header section;
- the time interval selector to choose the interval of data to show into the dashboard.
Under the header section the page displays the current dashboard selected by the user (or the default one). The layout of of each dashboard is part of the thing family configuration.
Edit the thing
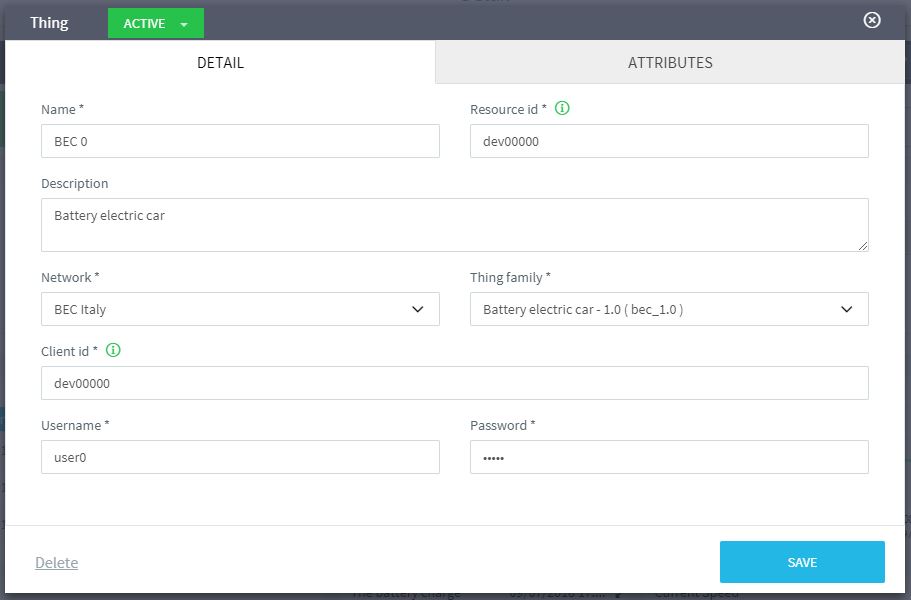
Select the Edit button in the edit section, it will open a new window.
 As you can see the window allows you to:
- change the main properties of the thing by filling the form and pressing the save button. The policy of the platform is to give maximum freedom in the changes, though you have to remember that the modification of some of these fields is a very delicate matter and should be carried out only if the meaning is well known;
- change the lifecycle status of the thing by selecting the new status in the top-left corner and pressing the save button.
Attributes of the thing
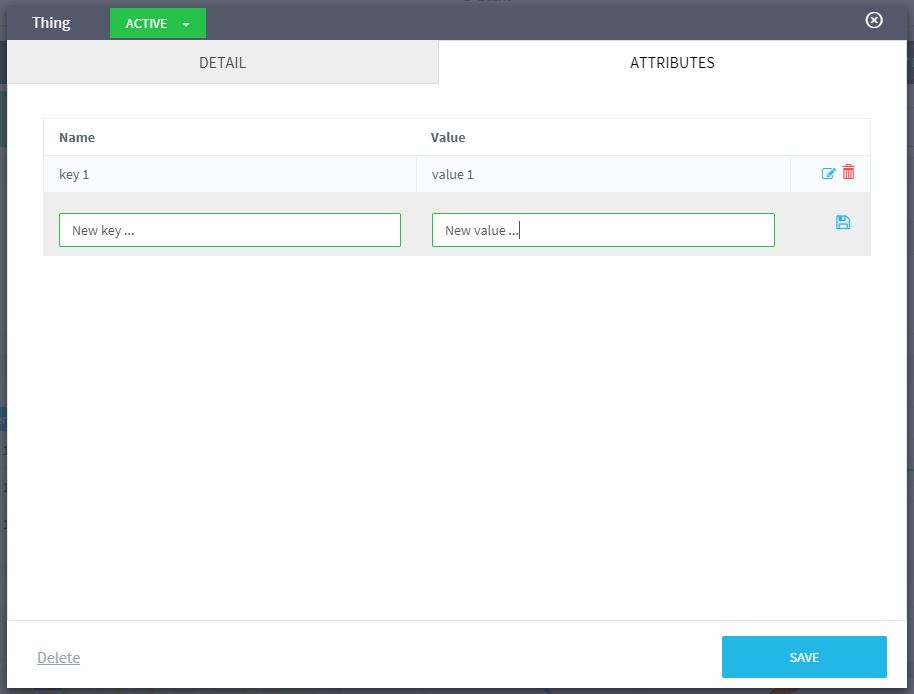
The thing can have some custom properties or attributes. Examples can be: geographic coordinates of fixed plants, threshold values, additional attributes useful for search, etc etc. Each attribute is a couple of key and value. To associate or modify a thing's attributes you have to:
- open the edit window and choose the Attributes tab;
- enter key and value of the attribute in the correspondent empty fields and press the save button at the end of the same row;
- in case you want to modify an existing attribute select the edit button in the correspondent row, modify the key or value and the press the save button on the same row;
- in case you want to delete an existing attribute select the trash button in the correspondent row;
- finally, please remember to press the save button of the window in the bottom-right corner.

Delete the thing
Open the edit window by selecting the Edit button in the top-right corner. The click on the delete link in the bottom-left corner. Before cancellation, the platform will ask you to confirm the operation.
Please note that the cancellation is not reversible, the thing will be completely erased from the system. If you want to perform a "logical" deletion you must change the status in outline or suspended.
Dashboard and time interval
The page display the dashboards defined for the family of the thing. Each dashboard displays data inside a specific time range. When the user enters the page for the first time, Omnyvore loads the first dashboard (remember that the priority order is defined inside the thing family configuration) and the default time interval (i.e., last 5 minutes). Nonetheless, the user can change these settings using the selectors in the header section.
If there are no dashboard defined Omnyvore will show a warning message to the user. The choices made by the user are saved and repeated the next time he enters the page.
The selector of the dashboard is a simple dropdown with the name of the configured dashboards: when the user selects one of them, Omnyvore reloads the page and displays the chosen dashboard.
The selector of the time interval is little bit more complex and when selected it opens a new section:

On the left side there are some quick filters whose meaning is self-explanatory, e.g., last 20 minutes means that the data interval will show data received within the last 20 minutes. On the right side there is a more flexible configuration. You can choose any moment in time as the end of the interval and how many minutes/hours/days/months you have to subtract from the end to get the start of the interval.
Share Dashboard
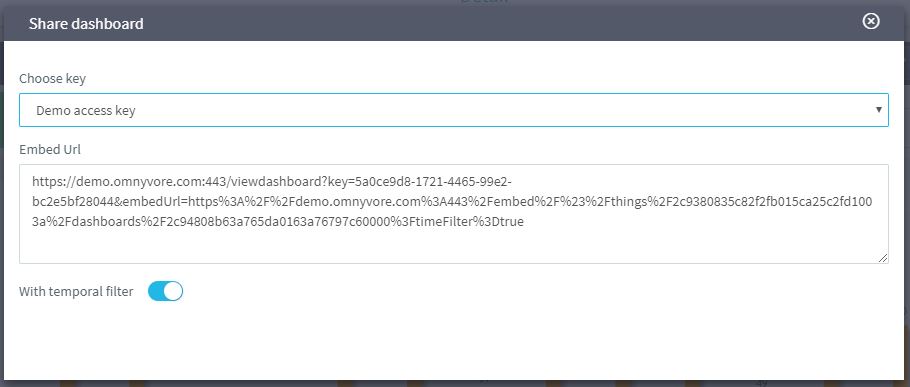
Each dashboard can be embedded in external sites by means of iframes. To do this you need to generate a new access key which will be used in the embed URL to fulfill Omnyvore's ACL to access data (more details in the Security section of this guide).
To generate the embed URL, proceed as follow:
- click over the Share dashboard button on the top-right corner (this will open a new window);
- select the access key you want to use (after that, Omnyvore will display a new text area containing the embed URL);
- decide if the embedded dashboard must have the time selector. If not, simply turn off the with temporal filter switch.
Lastly, you can simply copy the URL inside the textarea and paste it inside the src attribute of an external iframe.

Manage thing
In the header section there's also a Manage button which will get you to a new page with these functionalities: