Thing debug
The entire data flow which starts from the thing itself and ends with Omnyvore storing the actual measurement in its big data could be tricky to configure. For example, you must be sure about the outgoing firmware payloads and you must check if the scripts that process incoming data work correctly. Omnyvore provides some tools to help you in the debug process, which turn out to be very useful anytime you add or change your families some piece of configuration or anytime something smells bad. You can find these functionalities inside the Manage thing page.
Simulate the communication of a thing
Suppose that something is not working as expected: your thing is active and nothing buth nothing appears in Omnyvore.
At first, you have to understand whether the problem is related to Omnyvore's configuration or how the firmware is sending messages.
To help you locate the right side on where to look for the problem, Omnyvore allows you to simulate a thing communication without relying on the firmware installed on the thing.
May you want to do that, just select the Send data tab.
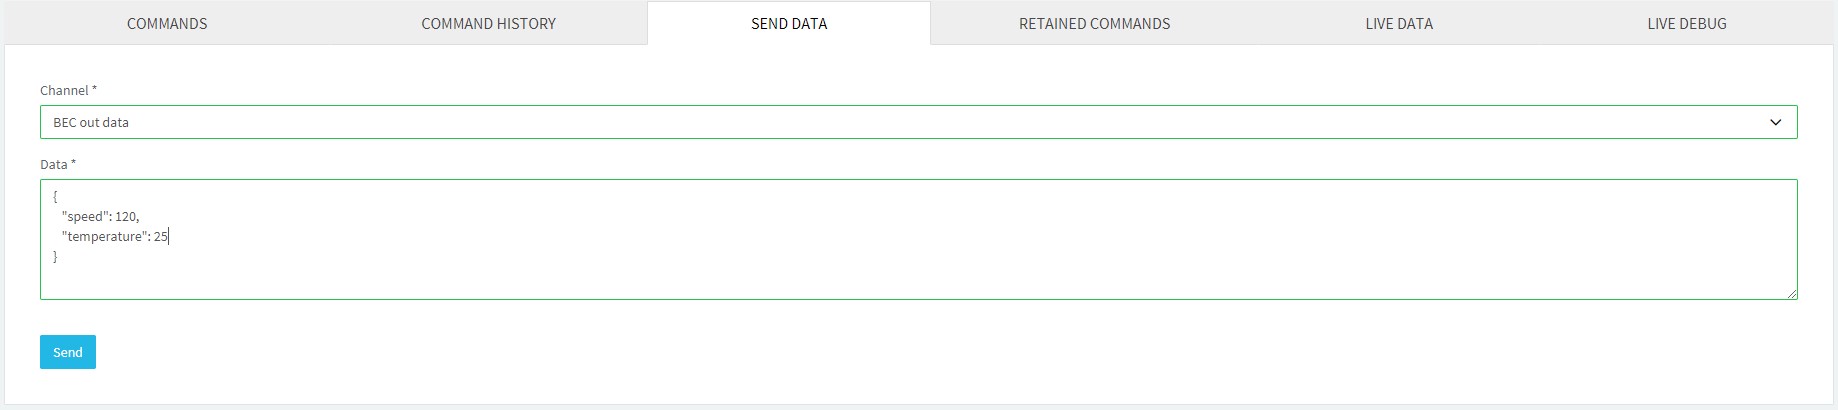
Then, just choose the receiving channel, write the payload you expect the thing to send and lastly click on the SEND button. The message will be sent to Omnyvore exactly as if it was sent by the very thing you are testing and all you have to do is checking whether the complete process works as expected, e.g., checking if the information sent is being displayed by the dashboard you configured in Omnyvore. If all seems to work fine, you will probably need to check the firmware inside the thing. On the other hand, if Omnyvore doesn't work as expected, you'd better check again the configuration of Omnyvore.
Check the real incoming message
Suppose you just find that your firmware is not sending the data as expected.
The first thing you want to do next is checking what really arrives to Omnyvore.
May you want to do this, just click on the Live data tab.
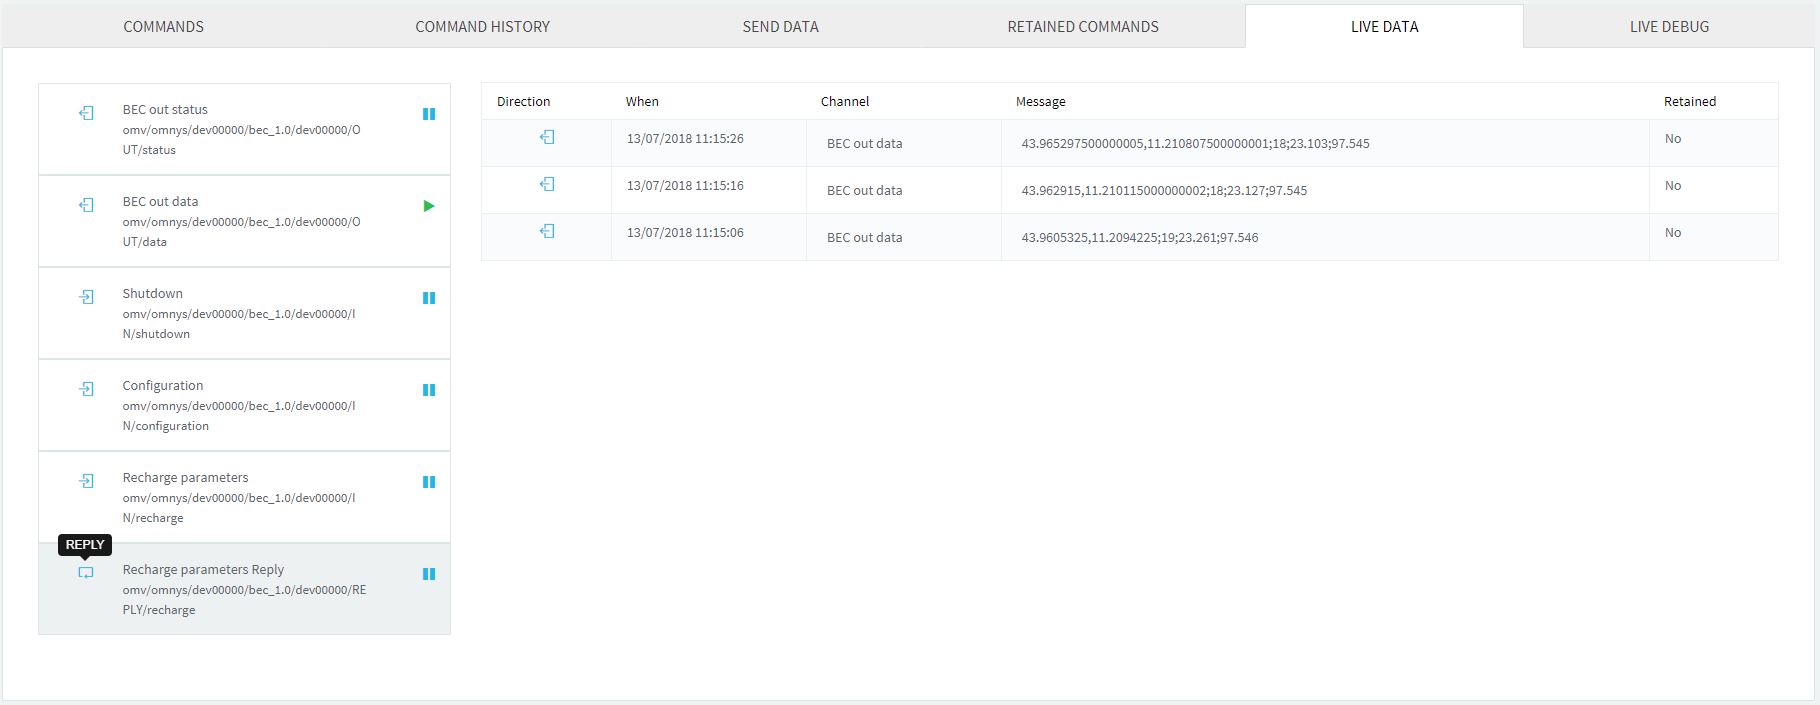 On the left column you can find all the channels defined for the thing family, whereas on the right there's the list of message which have arrived.
Please note that the list will display only the messages arrived after you enter it and only for the activated channel, since it is not an history which logs also messages received in the past.
To start seeing incoming messages you need to search the channel to inspect on the left and click on it. This will change the blue-colored pause icon to a green-colored play icon (meaning that the channel is currently activated and the right list will display its messages). You can activate more than one channel at once and you can deactivate then by simply clicking on them again.
Please note that you can analyze also the message going out of the platform, in other words the payload of the command you sent. This is very useful to test the reverse flow of data.
In the list of message each row corresponds to a new message and contains the following information:
- Direction: used to distinguish between messages sent by the things (OUT), payloads of commands (IN), or replies to commands (REPLY);
- Timestamp of the message;
- Channel: channel for data which arrives to Omnyvore or command Data going out of Omnyvore;
- Message: the raw message (i.e., payload) sent or received;
- Retained: yes it the message is retained (i.e., persistent in Omnyvore).
Check processing errors
Suppose that the raw message sent to the platform is correct but there's still something going wrong.
Probably there are some errors while processing data, i.e., all the operations performed between its reception in Omnyvore and the data being finally stored.
And, probably, there's something wrong in the very scripts which process data, but how to find the bug?
You can use the live debug function by simply selecting the Live debug tab.
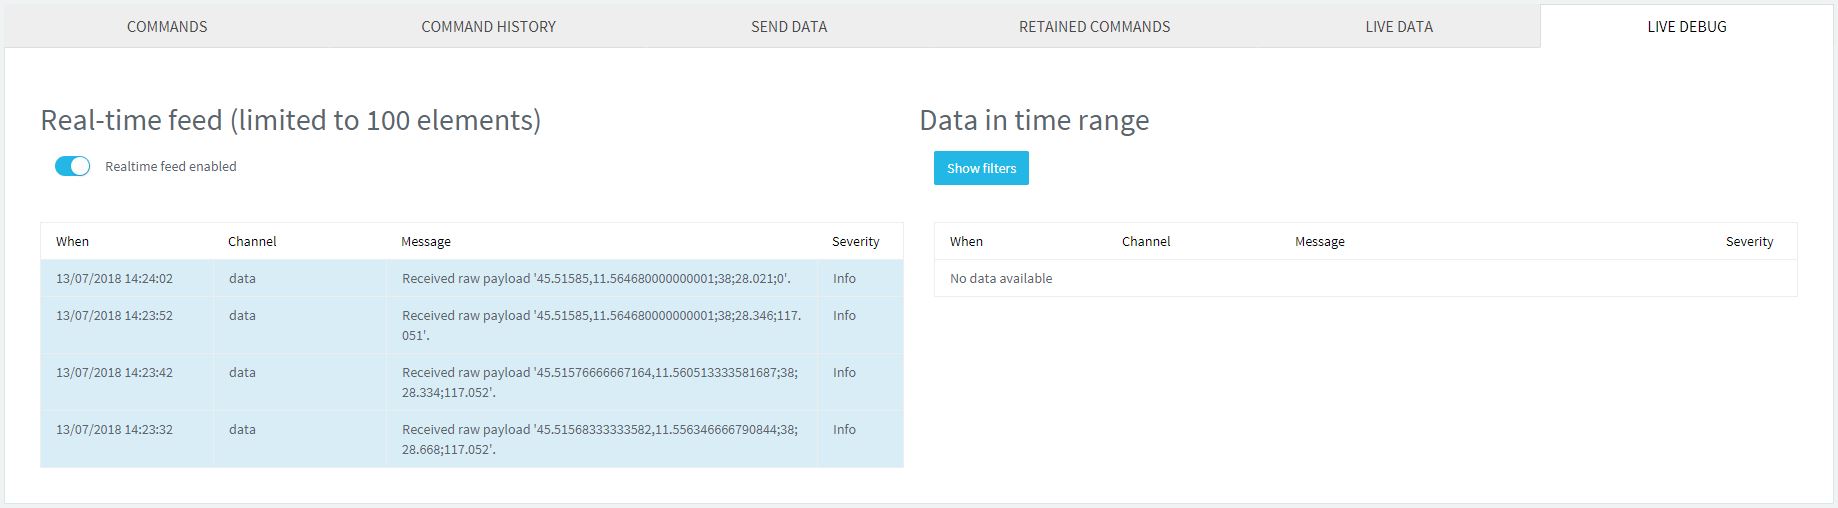
In this page you will see the log messages of what happens in the data processing flow. There are three kind of log:
- the input data received, which helps in correlating logs with other error messages;
- errors or warning log messages raised from the script engine (runtime execution errors);
- log messages written by the developer of the script (debug information about the execution flow).
By default this debug stream in not enabled, because otherwise it would produce a lot of unuseful data. To enable it and start viewing log messages, you have turn on the switch Realtime feed enabled. Until you stay in the current page, the feed will remain active, but when you exit the page it will stay enabled for 5 further minutes. If you want to stop it, simply turn off the switch.
On the right side you can also search the history of logs by opening the filters, and then selecting the time interval and clicking on the Filter button. This is helpful when you want to compare something in the past with something that is happening now, or when you want to debug something that happened overnight.
The history of log shows data collected only when the debug switch was enabled.