How to create new widgets
First of all, we may want to add further parameters to get a more comprehensive view of the stove status. As a matter of fact, we want to monitor the carbon monoxide and the humidity levels in our example:
- Add the new parameters carbon monoxide and humidity;
- Modify the processing logic of the measurements channel by using the following Javascript text:
var list = OMV.toString(payload).split(";");
var rawtemperature = list[0];
var temperature = java.lang.Double.parseDouble(rawtemperature)/100;
var fanspeed = list[1];
var now = new Date();
var timestamp = now.getTime();
var humidity = list[2];
var monoxide = list[3];

var measurementList = new java.util.ArrayList();
measurementList.add(new Measurement('temp', temperature, timestamp));
measurementList.add(new Measurement('fanspeed', fanspeed, timestamp));
measurementList.add(new Measurement('humidity', humidity, timestamp));
measurementList.add(new Measurement('co', monoxide, timestamp));

return measurementList;
Secondly, modify the existing control panel dashboard:
- Access to the control panel dashboard;
- Double click on the existing table widget to update the dashboard;
- Add the new parameters humidity and carbon monoxide;
- Click on SAVE.
Add new widgets
Creating new widget is similar to what we have seen for the send commands widget :
- Move to the control panel dashboard configuration view;
- Click WIDGET;
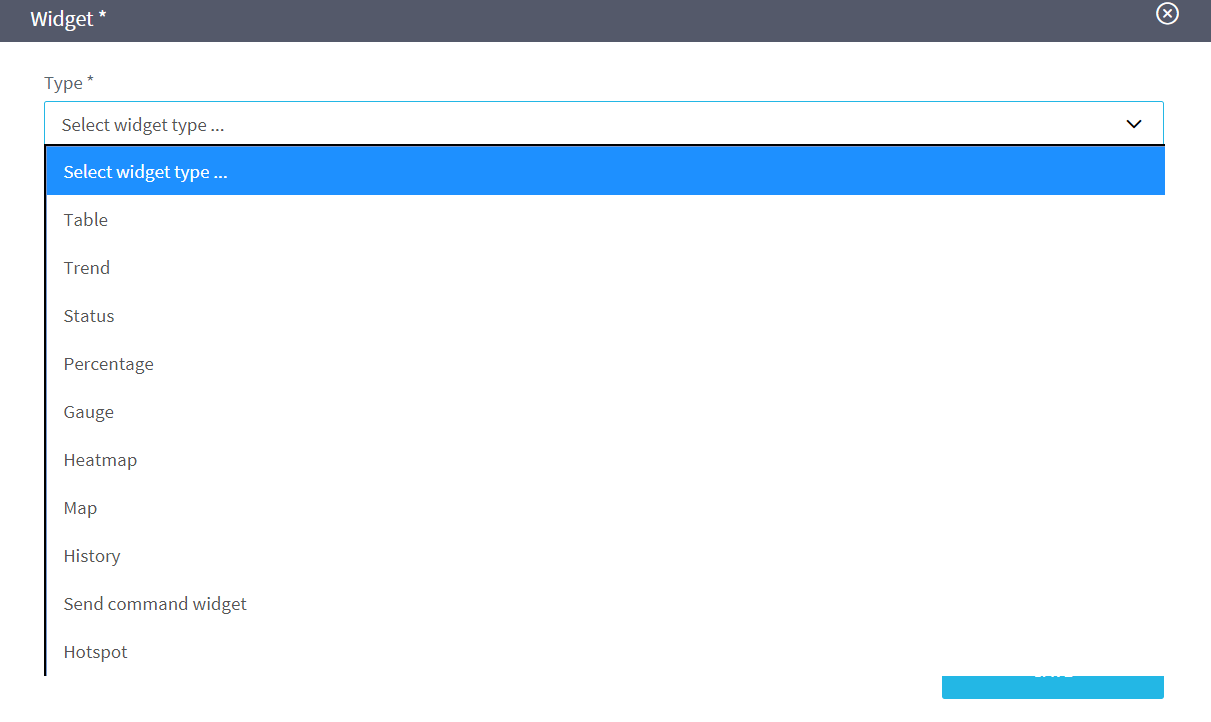
- Select the widget type according to your needs;
- Click on SAVE.
The following points are just suggestions to illustrate the most commonly used features of an Omnyvore dashboard. You can modify the colors, the values and type of a widget whenever you want.
Table widget
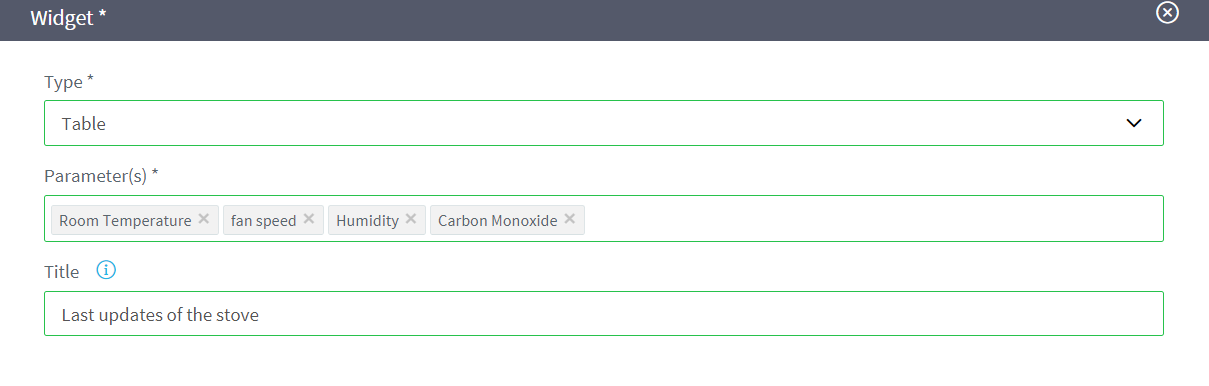
Table widgets show real-time data for several parameters.
Each parameter is displayed on a separate row and the table contains only the last values sensed for each parameter.
For instance, we can use it to see the last updates of the room temperature, fan speed, humidity, and carbon monoxide parameters.
Try to copy the configuration in the image below and then SAVE.
Trend widget
Trend widgets plots on a graph how data collected for several parameters varies over a time series. For instance, we can use it to have a visual perception of the correlation between the temperature and the humidity in a given period of time, or even some updates regardless of the time range. Try to copy the values shown in the images below. Because of the complexity of this widget, the example will be explained in a [specific section](http://docs.omnyvore.com/getting-started/create-new-widgets/visualize-data-trends).
Status widget
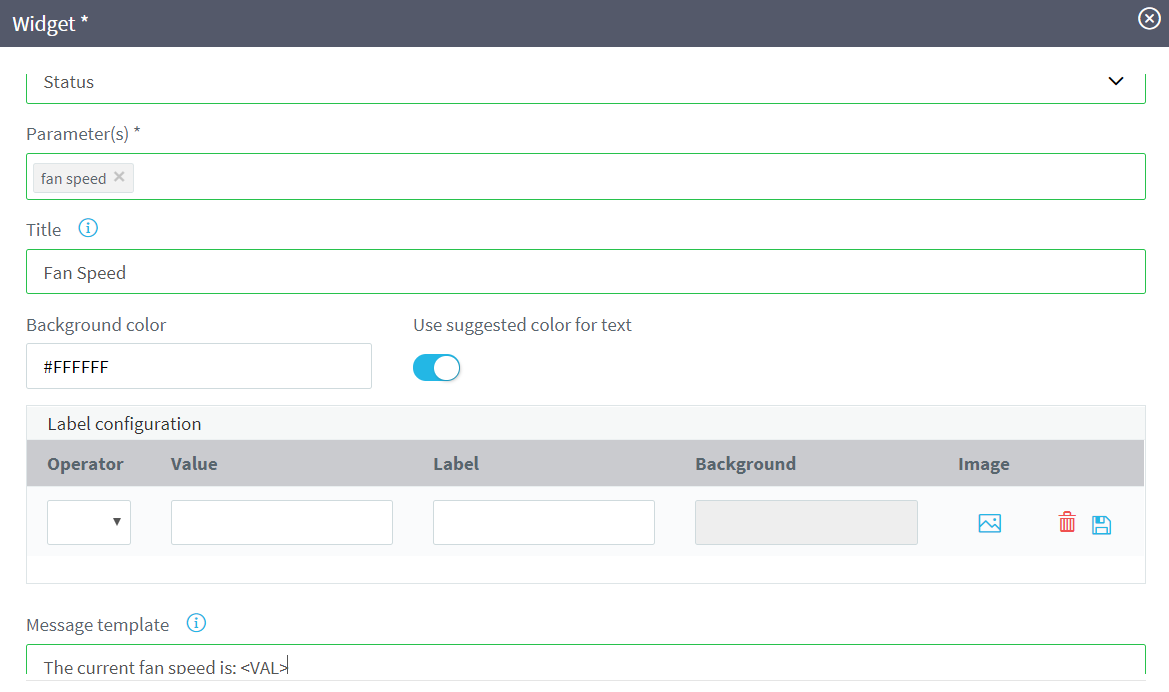
Status widgets provide quick and intuitive feedback for a single parameter.
For instance, fan speed could be easily represented by this kind of widget.
Try to copy the values shown in the image below and then click SAVE.
Percentage widget
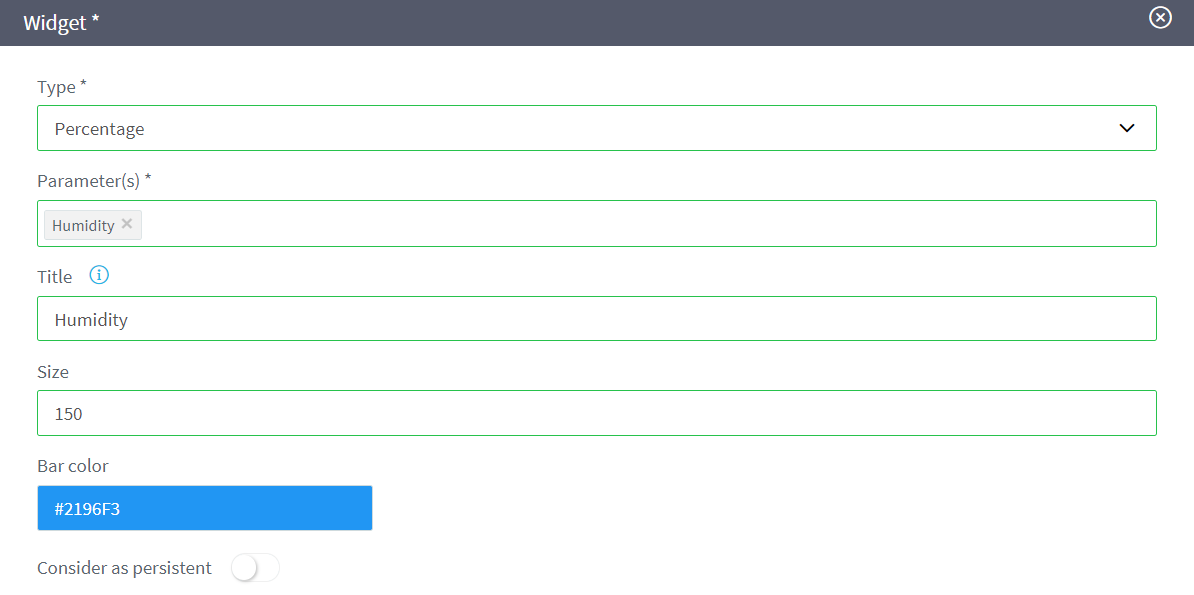
Percentage widgets show real-time data which ranges between 0 and 100 for a single parameter.
For instance, humidity is undoubtedly perfect for this kind of widget.
Try to copy the values shown in the image below and then click SAVE.
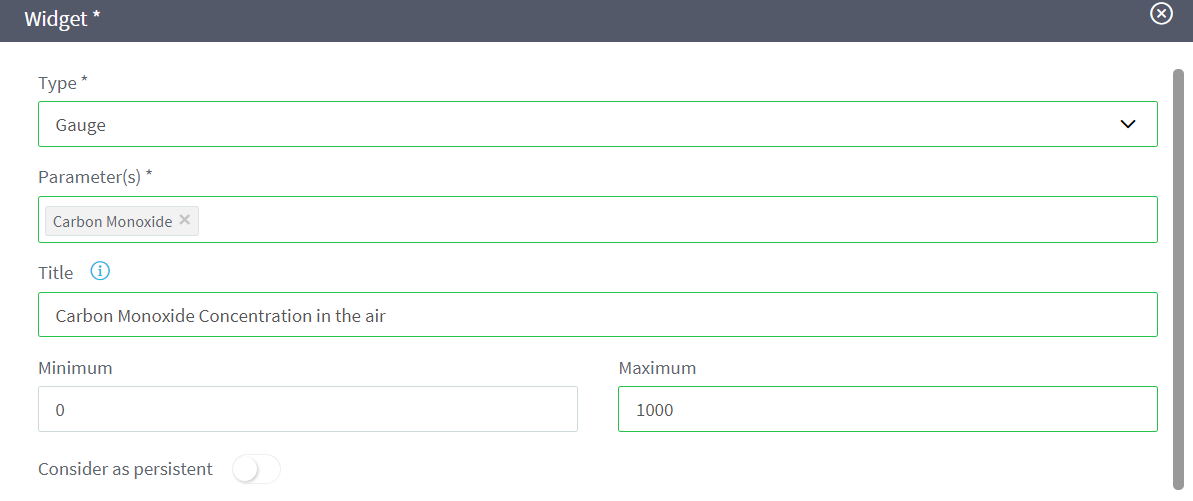
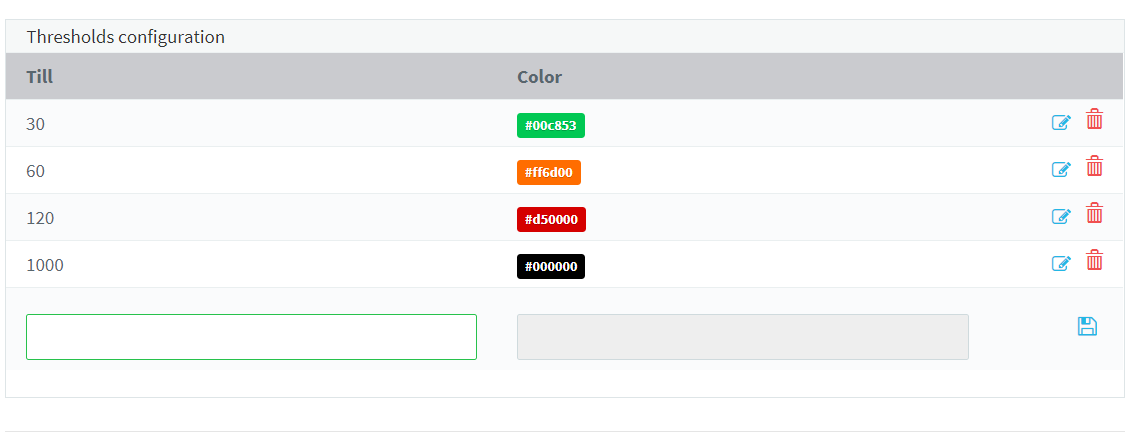
Gauge widget
Gauge widgets show real-time data which ranges between a minimum and a maximum for a single parameter.
For instance, the carbon monoxide concentration in the air could be easily represented in this way in order to alert people of a intoxication hazard.
Try to copy the values shown in the images below and then click SAVE.
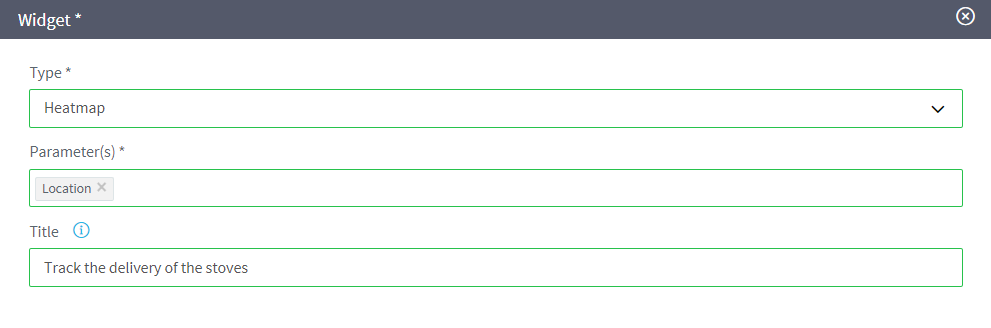
Heatmap widget
Heatmaps track the movement of a thing over a geographical region.
In this type of maps, red tracks are areas in which a thing stayed for long periods, while in green areas the thing was barely seen.
For instance, we want to track if the delivery service has reached the customer who bought the wood stove.
Try to copy the values shown in the image below and then click SAVE.
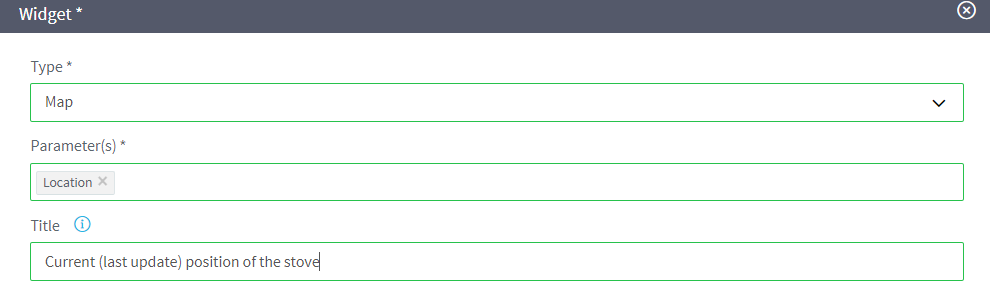
Map widget
Maps follow the movement of a thing over a geographical region.
In this widget, you will be able to see the current position of a thing by means of a marker placed on a map.
Try to copy the values shown in the image below and then click SAVE.
Examples for heatmap and maps widgets can be found here.
History widget
History widgets show real-time and historical data for a single parameter.
For instance, historical data about temperature may be an enabler to maximize the efficiency of the heating level.
Try to copy the values shown in the image below and then click SAVE.

Send command widget
This type of widget allows to send commands to a thing. We have already seen how to send commands, such as adjusting the temperature from the thing dashboard.
Hotspot widget
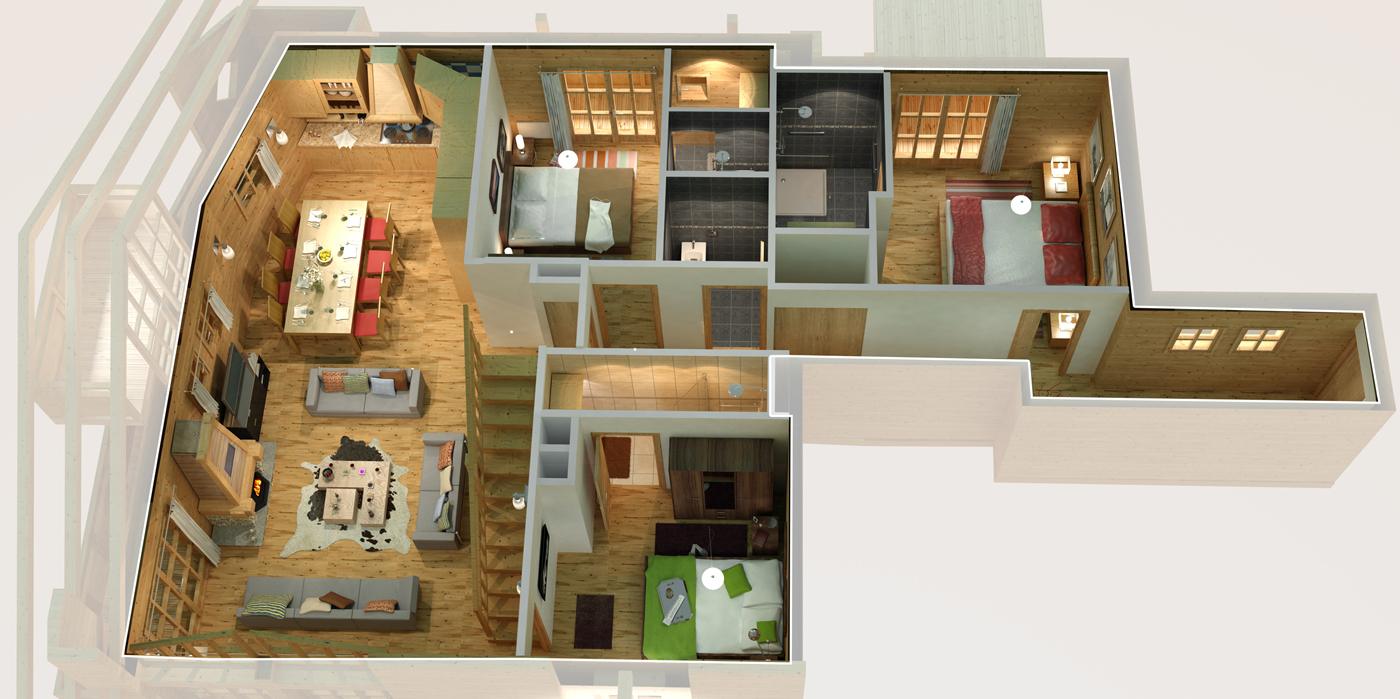
Hotspot widgets allow users to easily visualize information through images which represent the object, or the environment surrounding the thing.
For instance, we may use a 3D house picture like the following one to provide a fancier view of the data sensed by the stove.
- Load the image by using the media gallery ;
- Create a new hotspot widget by adding it to a dashboard, in the same way you created other kinds of widget;
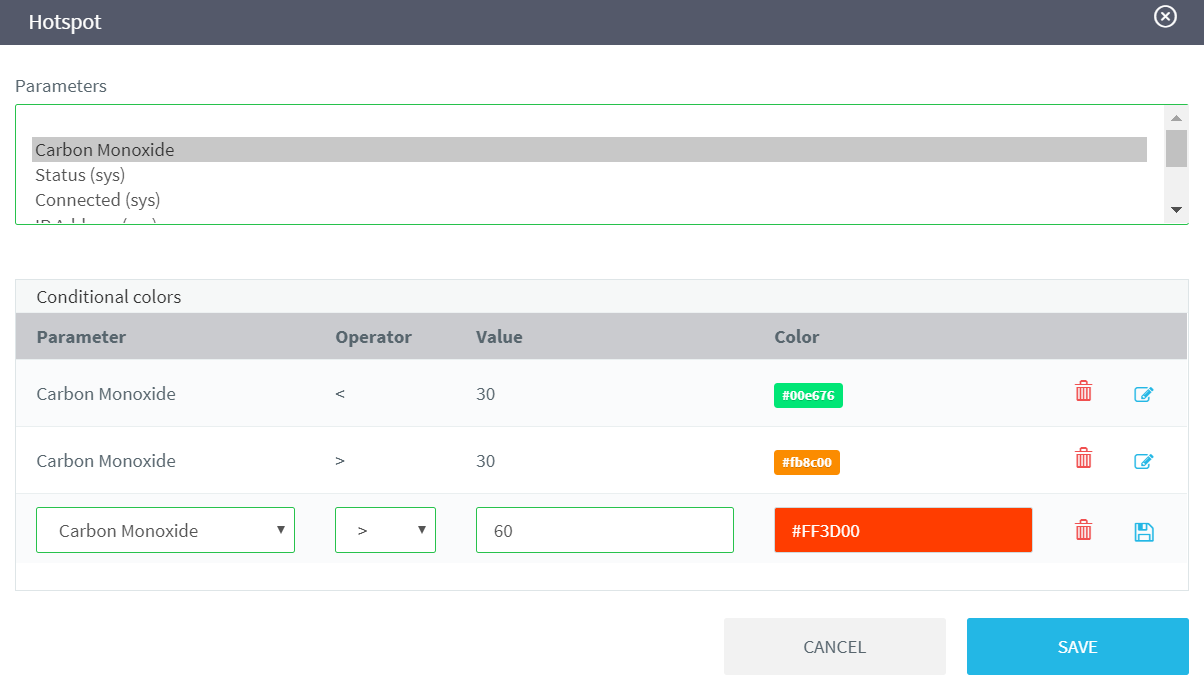
- Once the pop-up is opened, you have to:
- A new pop-up is automatically opened in order to set the colour of the values of the carbon monoxide level, and to ensure people safety in case of emergency.

Remember that you can drag and drop the widgets of the dashboard you create in order to organize and improve the visualization of the dashboard.