Configure the main dashboard
First of all, the main dashboard is different to what we have seen above, since we can monitor more than one thing at once. For instance, a landlord which rents out private flats with wood stoves might be interested in getting precise information about the status of its houses in the mountains and ensure that the tenants are living in acceptable conditions.
- Click Dashboard > Configure on the sidebar;
- Click WIDGET.
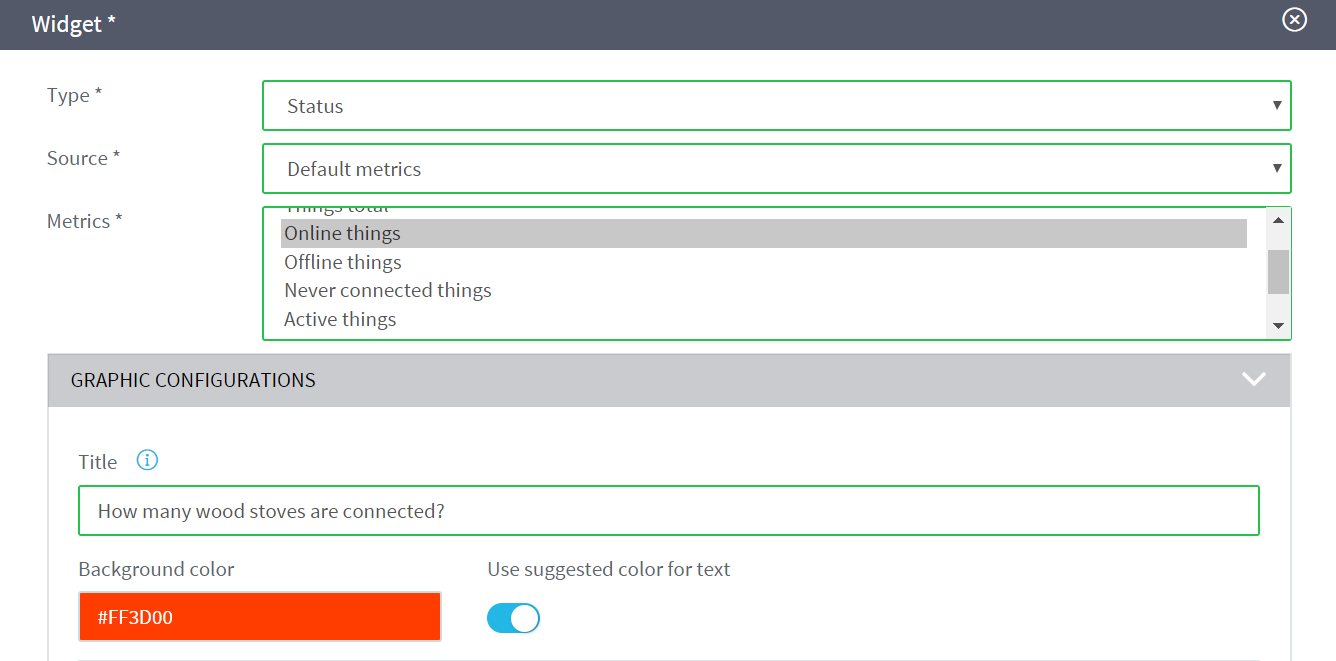
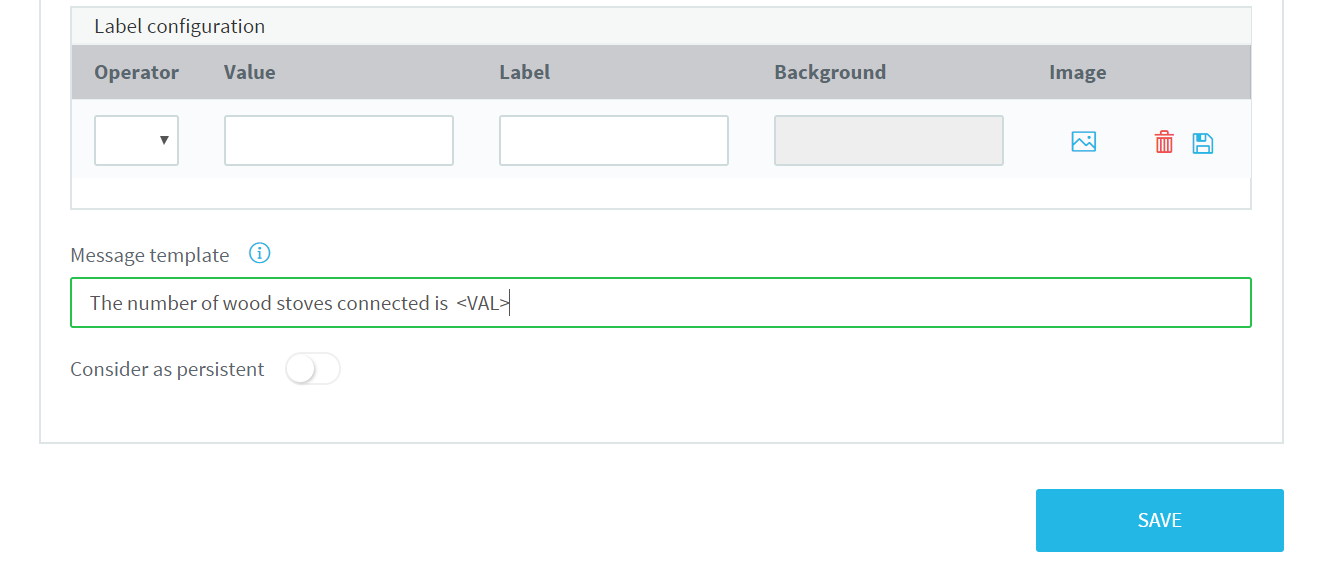
Are all the wood stoves connected?
A landlord probably wants to receive real time data about the stoves in order to continuously check its tenants are doing well. We assume that 4 of 6 buildings have been reserved, so the landlord is interested in checking how many stoves are connected.
Complete the pop-up as shown in the image below, then click SAVE.
Which are the wood stoves connected?
The landlord wants to know not only how many stoves are connected, but also which ones are connected!
He can localize where they are connected by selecting the widget: Map with combined data, and then clicking SAVE to persist the changes she made.

We simulate stoves sending their position by using MQTT.fx.
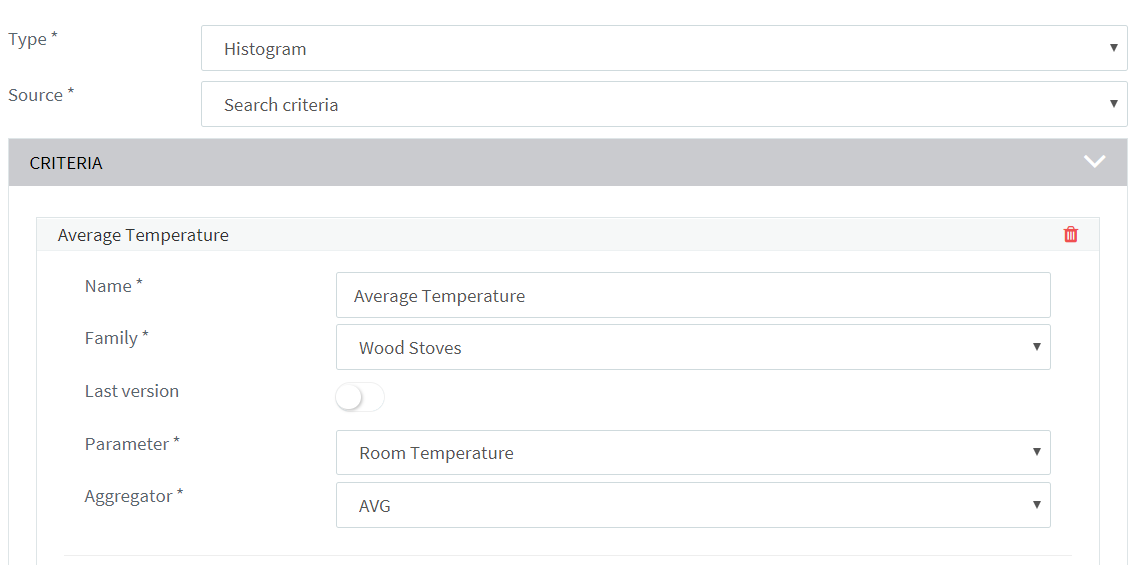
What about the average temperature?
The landlord is also interested in knowing the average temperature of her houses, so that she can predict how many tons of wood she needs to buy and to perform predictions for the years to come.
As a consequence, she will configure a histogram widget as follows: