Gauge (Widget)
Gauge widgets show real-time data which ranges between a minimum and a maximum for a single parameter. The numeric value fills up a half-circle as it approaches its maximum value.
Configuration
Parameters
Select the parameter you want to monitor.
Remember to select exactly one parameter. Otherwise, you will not be able to save the widget.
Title
Textual (usually short) description for what the gauge represents. It will be visualised in the widget header.
Minimum
Numeric value which will be used as the minimum threshold for the incoming data (default: 0).
Maximum
Numeric value which will be used as the maximum threshold for the incoming data (default: 100).
Persistence
ON/OFF button which, if enabled, extends the interval over which the search spans (default: OFF).
Absolute persistence
ON/OFF button which, if enabled, selects the latest measurement in an absolute sense, that is the selected interval will not be considered (default: OFF).
Number of days for persistence
Number of days for which the search will be extended (default: 7). This option is available only if Persistence is ON.
The provided number of days will be ignored if Absolute persistence is enabled.
Thresholds configuration
Thresholds are used to colour the gauge with different tonalities. For example, you may want to colour in blue low temperatures and in red high temperatures. To define a new threshold, write the upper limit in the Till option and then select the relative colour in the adjacent colour picker.
Remember to save thresholds before closing the editing modal of the widget. Any unsaved change will be lost.
Example
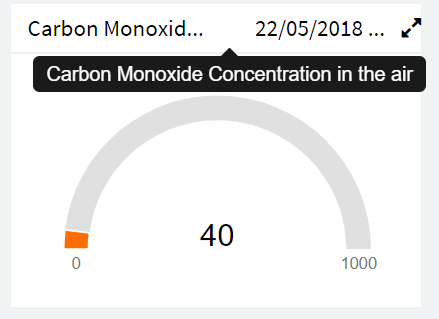
Other widgets
For an exhaustive list of the widgets you can use in Omnyvore, please refer to the Available widgets subsection.