Dashboard
A dashboard displays information about the thing we are monitoring by means of various widgets. For example, we could see a graph that plots how the heat produced by a stove varies over time, or a gauge which indicates the current speed of a car.
All the dashboards prepared for a certain family are listed in the "DASHBOARDS" tab of the thing family detail page.

Create a new dashboard
Select the Add button in the top right corner of the tab:

Fill in the form by specifying the following properties of the parameter and then press the Save button:
- Name: a mnemonic name for the dashboard
- Description: a textual description of the purpose of the dashboard
Remember to press the Save button in the dashboard view to submit any changes you have not applied yet.
Should you want to add some widgets to the newly created dashboard, please refer to the Add a widget subsection.
Edit an existing dashboard
To swap the order of two existing dashboards, use the arrows on the right.
If you want to edit an existing dashboard, click on the corresponding row in the dashboard list and then:
- click on the Modify in the top bar to edit the dashboard details
- refer to the Add a widget subsection to add new widgets
- refer to the Edit a widget subsection to edit existing widgets
- refer to the Dashboard composition subsection to build dashboards
Delete an existing dashboard
If you want to delete an existing dashboard:
- click on the corresponding row in the dashboard list
- click on the Delete button
- click on the Confirm button
Available widgets
Here is the full list of the widgets you can use in a dashboard of a thing:
Add a widget
If you want to add a widget to a dashboard:
- open the dashboard builder (that is, create or edit a dashboard)
- click on the Widget button in the top bar
For more details on which widgets you can use in Omnyvore, please head to the Available widgets subsection.
Edit a widget
If you want to edit an existing widget of a dashboard:
- open the dashboard builder (that is, create or edit a dashboard)
- click twice on the widget you want to modify
For more details on which widgets you can use in Omnyvore, please head to the Available widgets subsection.
Dashboard composition
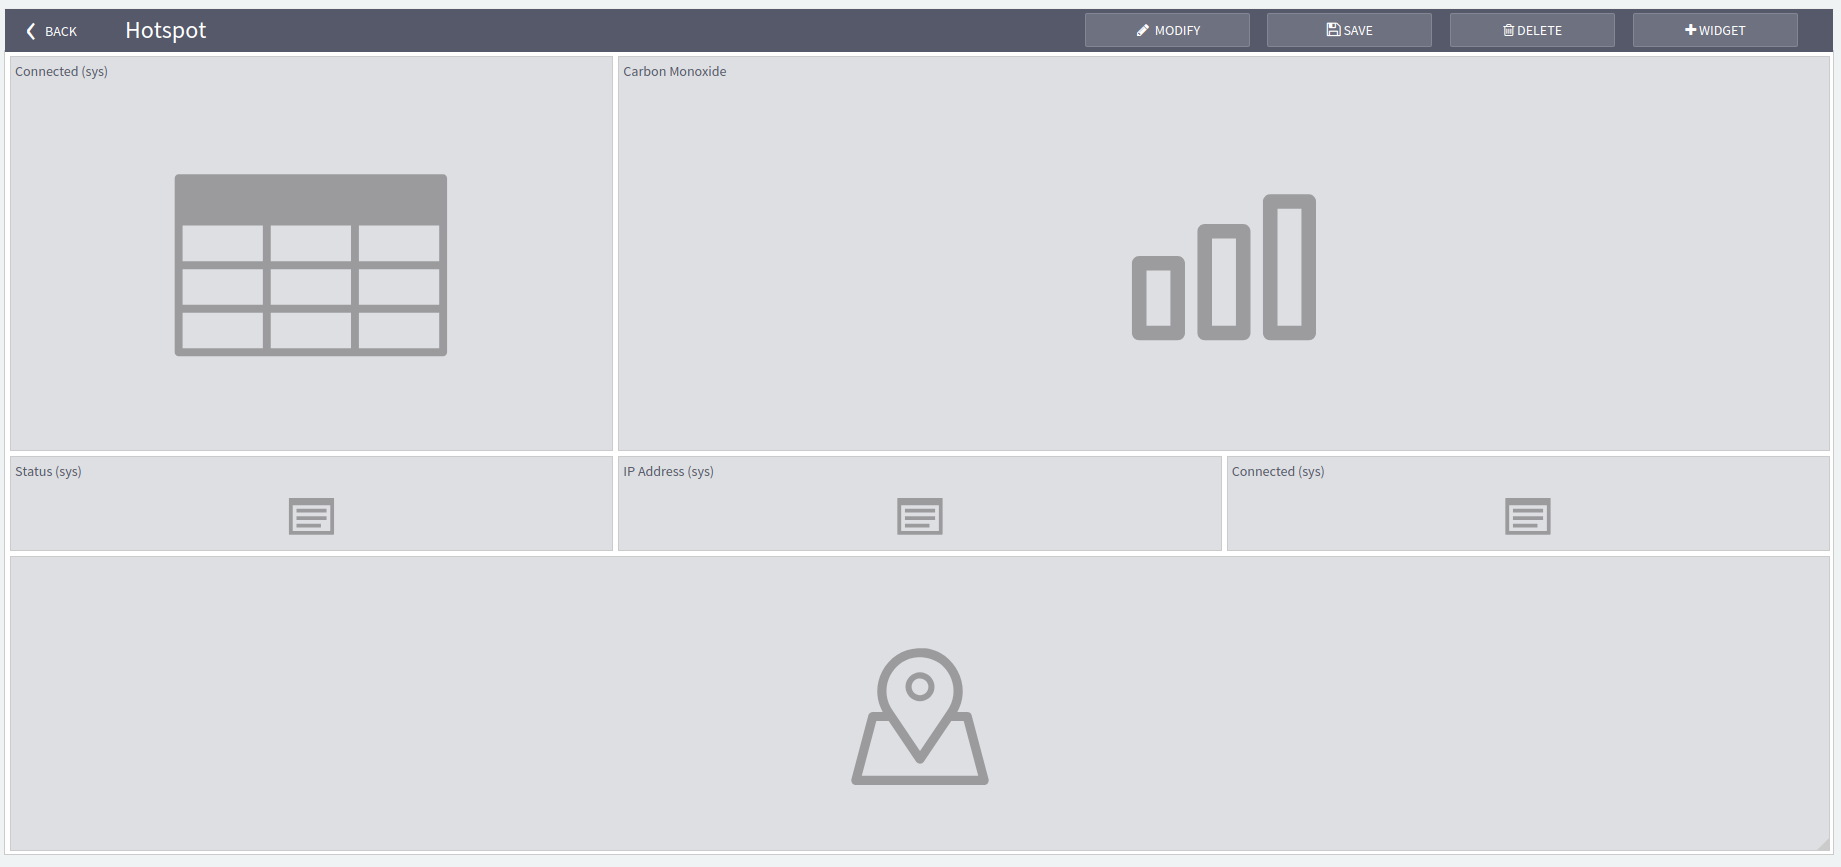
Dashboards can be composed thanks to a builder view, which opens up after clicking on a dashboard in the dashboard list view.
In this view, you will find widgets arranged in a grid.
Widgets are wrapped in rectangular boxes and can be moved around with drag-and-drop.
The widget size can be adjusted by dragging the widget boxes from their corner.
If you want to add or edit a widget, please refer to the subsections Add a widget and Edit a widget.
