Trend (Widget)
Trend widgets plots on a graph how data collected for several parameters varies over a time series.
Configuration
Parameters
Select one or more parameters you want to monitor.
Remember to select at least one parameter. Otherwise, you will not be able to save the widget.
Title
Textual (usually short) description for the plot. It will be visualised in the widget header.
Hide legend
On/Off button which toggles the presence of a legend next to the plotted data (default: OFF).
Aggregation limit
Sometimes Omnyvore collects a huge amount of data, even for a single thing. Therefore, a very dense plot may incur performance problems as the number of points increases. This option allows you to select the maximum number of points which are plotted on a graph (default: 500). Throughout this page, we will refer to this value as L.
Aggregation function
Function which Omnyvore will use to aggregate data points which are close, but only when the aggregation limit is exceeded. The available aggregation functions are:
- AVG: compute the average of the given points
- MAX: select the maximum value among the given points
- MIN: select the minimum value among the given points
Aggregate on time intervals
On/Off button which toggles the aggregation on time intervals (default: OFF).
- ON (on the left): group data points in L time ranges of equal length (e.g., one day each)
- OFF (on the right): group data points in L clusters, each containing (almost) the same number of points

Per-parameter configuration
Trend widgets can display data for more than one parameter. In order to choose how a parameter will be plotted:
- select the parameter it in the Parameter(s) configuration option
- click on the accordion button CONFIGURE PARAMETER parameterName, where parameterName is the name of the parameter you want to configure
- follow the instructions given hereafter
Line colour
Pick a colour for the line of the graph which represents the parameter (default: random colour).
Represent as a step function
Plot the data points as if they were a step function, i.e., only using vertical and horizontal lines (default: OFF).
Show only points
Do not show anything but points, i.e., lines will not be present in the graph (default: OFF).
Point dimension
The dimension of the points, in pixels (default: 1).
Point type
The shape of the points: square, circle, diamond or cross (default: circle).
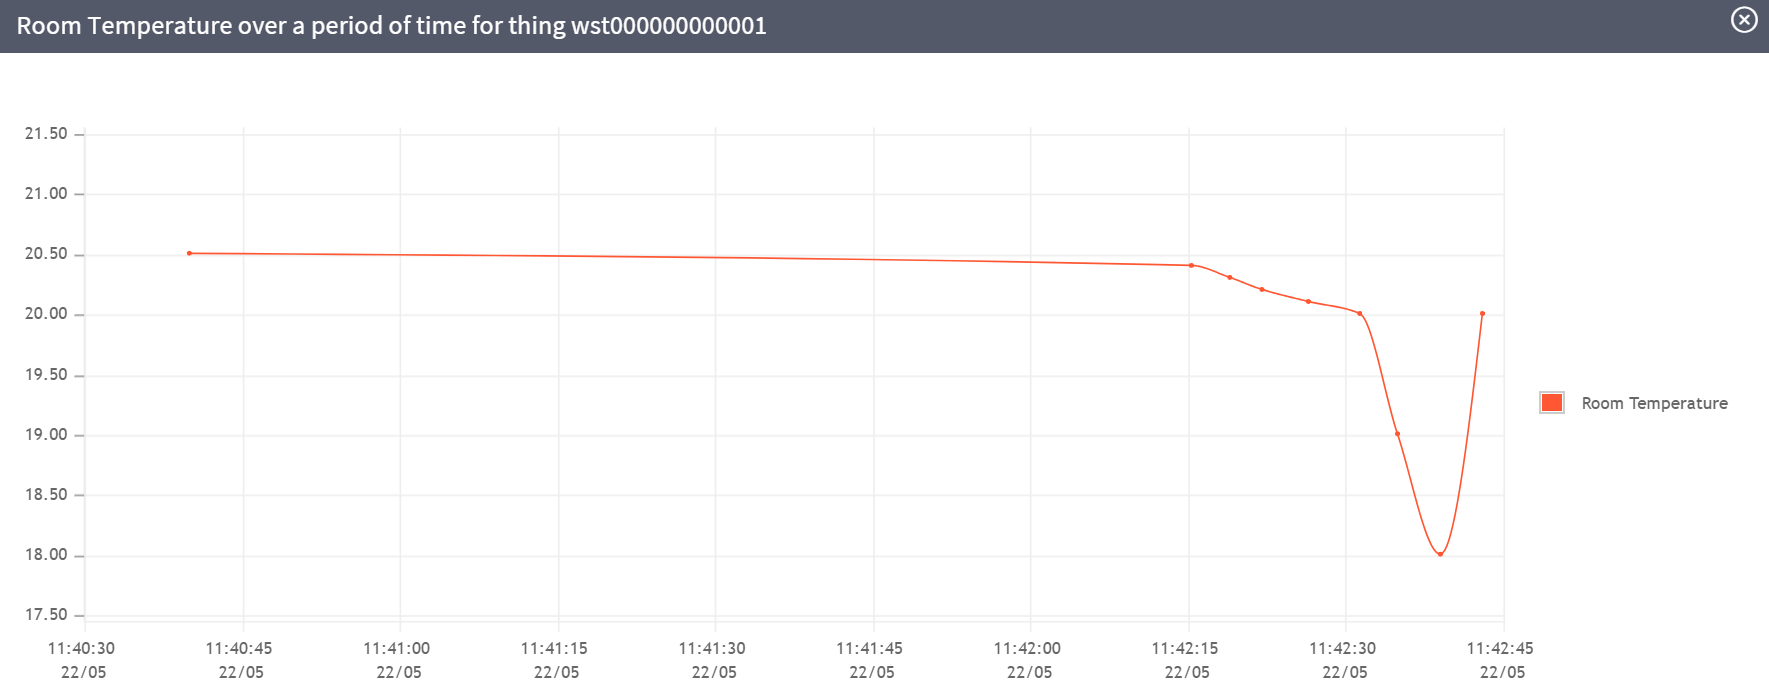
Example
Other widgets
For a complete list of the widgets you can use in Omnyvore, please refer to the Available widgets subsection.